
A Short Guide to Foren6
Why Foren6? | GUI Overview | Packet Sources | Network Visualizer | Multiple Sniffers | Get Started
Why Foren6?
Foren6 is an effort to provide a non-intrusive 6LoWPAN network analysis tool. It leverages passive sniffer devices to reconstruct a visual and textual representation of network information to support real-world Internet of Things applications where other means of debug (cabled or network-based monitoring) are too costly or impractical. This guide describes each part of the application and provides useful user information.
GUI Overview
Foren6 is a Qt application with fixed and modular widgets. In its most basic form, the application resembles the image below. A Network Vizualizer window offers a graphical view of the network topology, representing the preferred parent of each module if the network uses the RPL routing protocol. When clicking on a sensor, a Node Information window displays all the information about the mote available at that time. Both the Network Visualizer and the Node Information are time-dependant, and depict the state of the perceived network at the point in time set by a Scrollable Timeline at the bottom of the window.
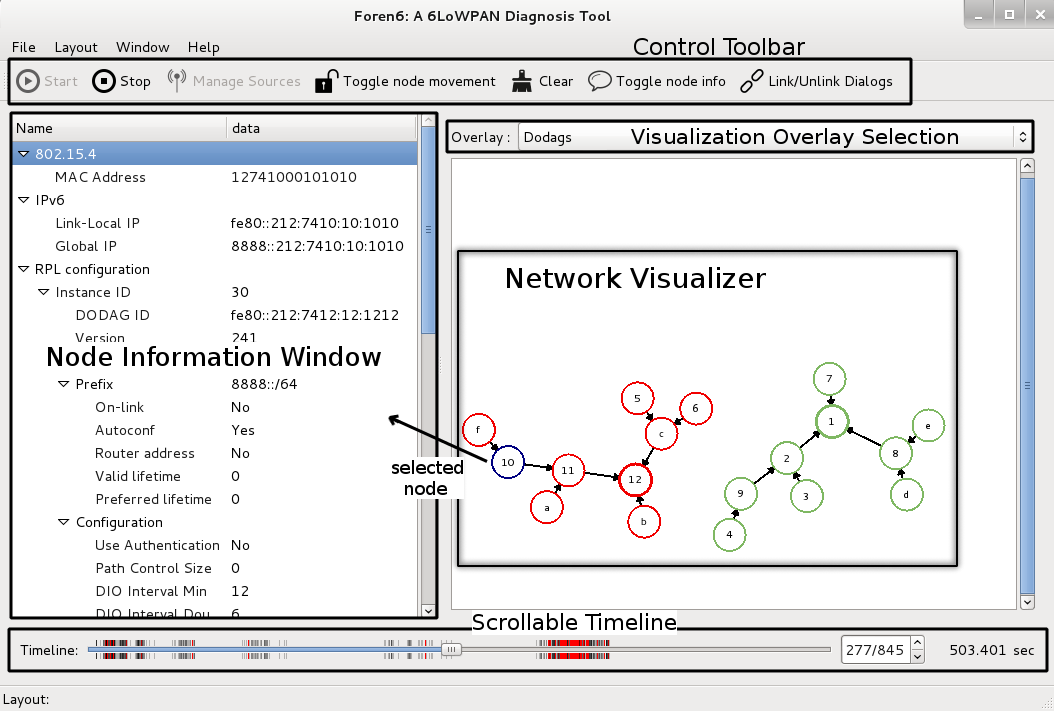
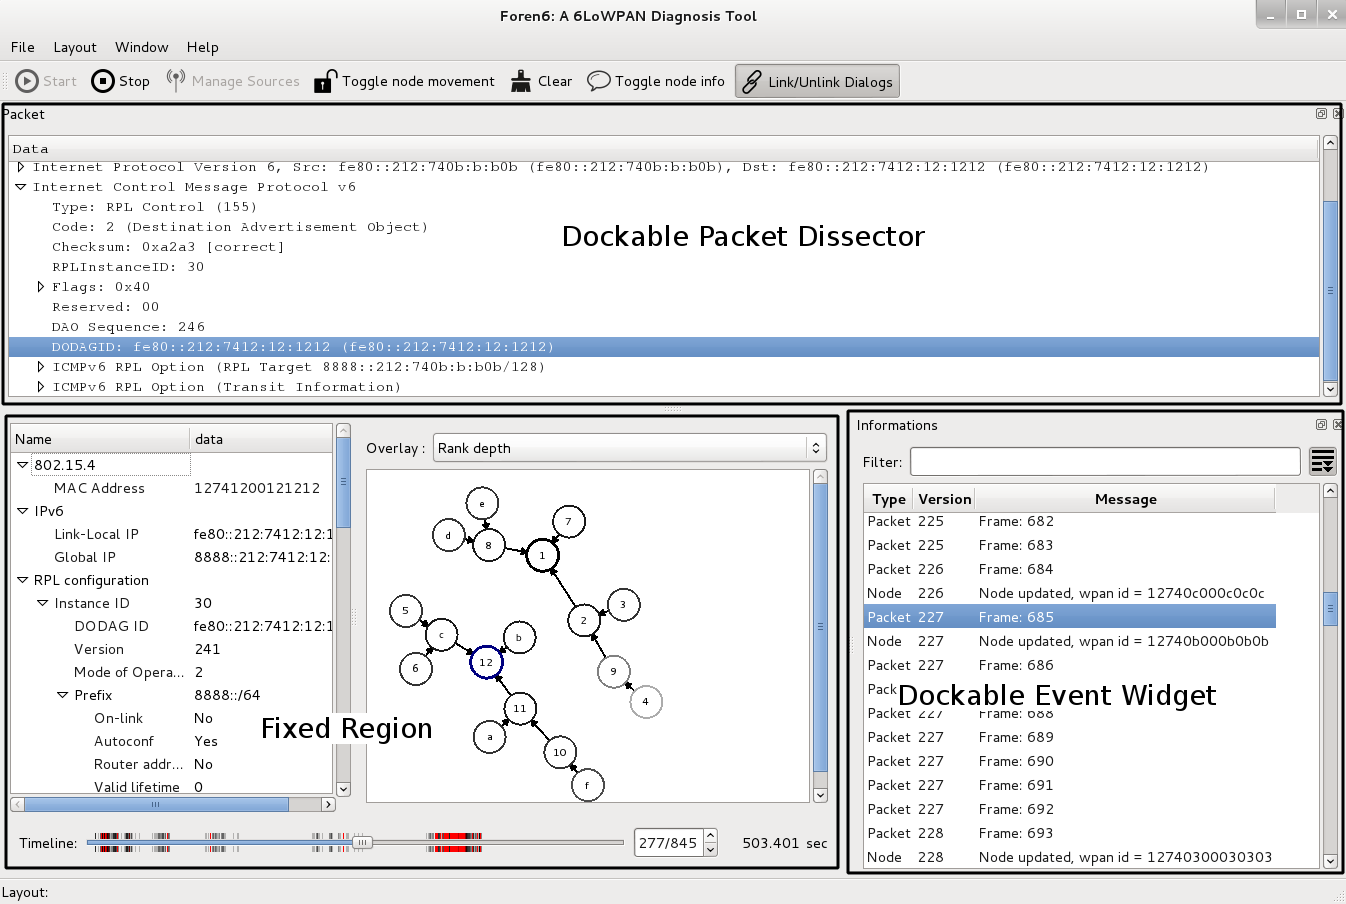
The main window can be extended with dockable widgets, providing optional information. The Event Widget lists the history of all the events which occurred since the start. An event can be a new packet or a change in a node or network state detected by the internal analyzer. A filter field allows to narrow down the list of events to a particular type. The Packet Dissector lists the full packet info when a packet is selected in the Event Widget. The dissection is based on tshark, and is thus similar to Wireshark. The dockable widgets can be added through the 'Window’ menu, and their position is persitent after the application is closed.
Packet Sources
Foren6 can be interfaced with 3 types of packet sources: physical sniffers on real networks, previously-recorded packet trace files and simulated networks.
1. Analysing a real network via physical sniffers
Foren6 can capture live captures from physical 802.15.4 sniffers. It supports 2 types of sniffer hardware:
- Any Contiki-compatible CC2420-based mote with a USB connector. CC2420 motes can serve as a sniffer, provided is it programmed with a specific Contiki application. The TelosB, CM5000 and Z1 have been tested and are known to work.
- Other sniffers which generate PCAP outputs. Many other devices can serve as sniffers. They each use a generic FIFO mechanism to stream pcap data to Foren6. Here are seperate instructions for the platforms which are known to work. Note: in each procedure, it is important to read from the FIFO before writing to it, because the pcap headers are not necessarily repeated, so the order in which these intructions are given is important.
- Econotag
- Get libmc1322x and compile all firmwares
git clone https://github.com/malvira/libmc1322x.git
cd libmc1322x/tests
make
- Program the Econotag with rftest-rx from the tests folder. Refer to the libmc1322x documentation for help on how to do that.
- From a terminal, create a fifo
mkfifo /path/to/fifo.pcap
- Open Foren6. Set the /path/to/fifo.pcap as source (Manage Sources —> Browse to the fifo.pcap, set PCAP type, do not set the channel). This dialog will hang, until the next step is complete, because it expects to read a PCAP header in the FIFO. This is intended, and will be improved in the future.
- In a console, launch the rftestrx2pcap.py from libmc1322x
cd ..
./tests/rftestrx2pcap.py /dev/ttyUSB1 24 /path/to/fifo.pcap
- Go back to Foren6 and click the Start button.
- Get libmc1322x and compile all firmwares
- Atmel RZUSBSTICK
- Coming soon
- Microchip ZENA
- Coming soon
- ...
- Econotag
2. Analysing previously-recorded packet traces
For instructions, please follow Example 1
3. Analysing a simulated network
A COOJA network can be interfaced via the FIFO mechanism described above. This requires a recent patch to Contiki which has not yet been merged. We will update this documentation as soon as the merge is complete.
The Network Visualizer
The Network Visualizer window represents the status of the nearby 6LoWPAN networks. We will cover the basic functionalities offered by the Network Visualizer, then introduce site-specific customization using Layouts and cover the different Overlays available to visualize different types of network-related info.
Basic functionalities
Each 6LoWPAN host is drawn as a circle with a hexadecimal number inside, which is the last two bytes of the mote’s MAC address. Motes can be renamed at any time by right-clicking them. An alternate name will appear thereafter instead of the hexadecimal ID.
By default, mote positions are unknown to Foren6, and the application doesn’t attempt to use RSSI or time-based techniques to calculate the mote positions (Foren6 is not a localization tool). Instead, motes appear at arbitrary positions inside the Network Visualizer and obey to two simple rules to form a tree: motes attract each other if they form a child-parent relationship, and repell otherwise. This technique was inspired from the Contiki Collect View application. To avoid unwanted movement, each mote can be individually pinned to a particular position in the window by clicking the mouse wheel on the mote, or selecting lock/unlock when right-clicking the mote. A global setting can toggle the node movement altogether, using the Toggle Node Movement button in the taskbar. In all situations, motes can be individually displaced with a drag & drop.

Layouts
The Network Visualizer can be customized using Layouts. With layouts, the user can specifiy predefined mote positions inside the Network Visualizer for some or all motes, and load a background image. A layout can be constructed within the application itself, by pinning motes to desired positions and loading an optional background from the Layout Menu. From the Layout Menu, the current layout can be exported to a configuration file for future use. You can also create layouts by editing a layout file manually following this example layout:
[General]
background=
scale=1.2

[12740100010101]
x=0
y=0
locked=true

[12740200020202]
x=0
y=50
locked=true

...etc
The Foren6 sources provide a few example layouts. The following 3 examples can be reproduced from the samples contained in the example folder.
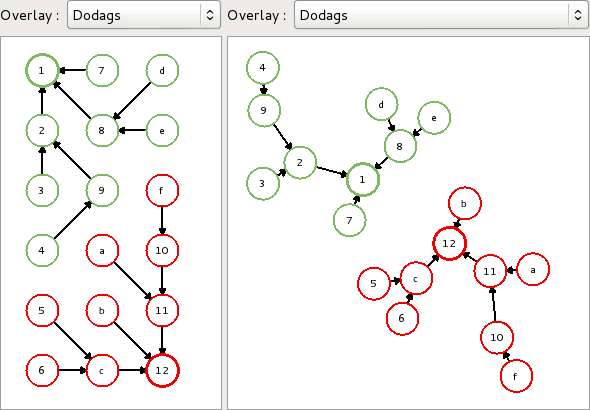
Layout Example 1: Grid Topology
Below (left), is a screenshot of the layout example-layout-grid-3×6.ini while replaying a COOJA simulation with motes spread out in a 3 by 6 grid. To the right, the same network is viewed at the same moment in time, after selecting 'Clear Layout’ from the Layout Menu.
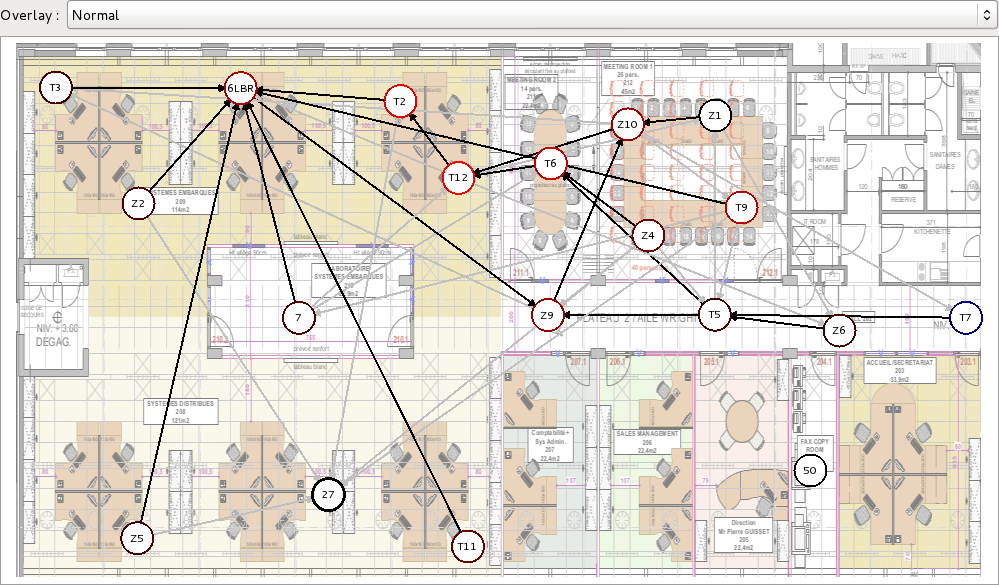
Layout Example 2: Building walls with real sensor locations
Layout Example 3: Sensor images for a demo
todo: show CETIC JDL demo layout
Overlays
Overlays allow to customize the Network Visualizer according a certain metric or parameter. Most overlays consist in changing the mote colors, while a few also control the thickness of the parent-child arrows. Overlays involving numerical metrics provide extra information in the form of a label, under the mote name, which can be toggled with the Toggle Node Info button.
Normal Overlay
The default overlay
Dodags Overlay
In the Dodags overlay, motes are assigned a fixed color based on their DODAG ID. This ID is a RPL-related parameter uniquement identifying a DODAG by the global IP address of its root.
RPL Instance Overlay
Foren6 currently supports instances in a limited way: nodes from different instances will be displayed in different colors in this overlay, but the application is not yet compatible with motes participating in multiple instances simultaneously (nor does Contiki support that at the moment).
Node Traffic Overlay
The Node Traffic overlay assigns a greyscale value to motes based on the total number of packets they sent since the beginning of the capture. The scale is calculated by assigning the RGB color 0×000000 (black) to the mote with the highest number of packets, and a light grey to the mote which sent the least amount of traffic (gradually closer to white (0xFFFFF) as the scale size increases).
An example is shown below, in a network where mote 17 sends a constant stream of ICMP Echo Request (Ping) messages to mote 1. We see that the motes along the path from 17 to 1 are dark because they have forwarded a lot more traffic than the rest of the nodes. Since the traffic is bidirectional (1 replies to the pings), we see that the intermediate motes 6, 8 and 9 sent about twice the amount of traffic than 17 and 1 (as expected), with the Node Info toggled ON.
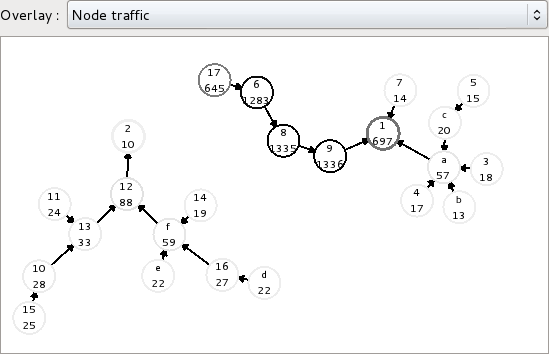
This overlay turns out to be very useful to identify highly-sollicited nodes in the network, which is important to monitor if the sensors are running on batteries.
Max DAO/DIO Interval Overlays
The next two overlays define a greyscale coloring based on the maximum interval between two successive DAOs and DIOs heard from each mote.
Errors Overlays
A series of Error Overlays detects incoherent network states/messages and uses a red scale to locate them on the topology. The different errors currently displayed are:
- Rank errors
- Routing loop errors
- IP mismatch errors in DAO destination
- DODAG mismatch errors in DAO
Parent/Child Highlighting
Finally, a Parent/Child Highlighting overlay darkens the parent and child nodes of the currently selected node. It helps to navigate through very large networks.
Multiple Sniffers
todo
Get Started
To get started, we invite you to follow these introductory examples.